Garmin + ELK Fun

The quality of reports on garmin connect is disappointing to say the least. Some things I wanted:

  • Daily/Weekly over time. Garmin has fixed presets. At 6 months or a year, you only get monthly counts.
  • Control the date range - Garmin has week, month, 6 month, year fixed views, and fixed buckets in said views.
  • Exclude my commute rides. It skews the averages. What is my cadence/pace on only >20km bike rides?
  • It would be fun to do.

Unfortunately Garmin charges(!) to use their API. Disappointing. The simplest method for data I found was to manually export(20 events at a time..) from garmin connect. This gave me a bunch of .csv files to work with.

Initially I tried to just use a file input on logstash with the csv filter. Unfortunately Garmin is not consistent with it's data formats in events. The biggest issue were pace/speed fields varying. "1:50 min/100 m" - swimming, "15.6" (kph) - cycling/rowing/some swimming, or "4:30" (4:30/min km) - running/walking.

I ended up writing a python parser to do the following:

  • Read conf file indicating format of csv/important fields for each activity type in the csv
  • Convert fields into usable formats for Kibana graphing
  • Generate json logging/send to Logstash 'ready to go' for ES/Kibana.

The current version of the parser is here . It's rough, but works. Imported all 377 activities from my garmin account going back 2.5 years. Including some that were initially imported from run keeper to garmin, resulting in very odd formatting.

Now that I have the initial import working, i'll add a check against ES to prevent sending a duplicate activity to ES during imports. Ideally i'll find a way to automate fetching the 'last 20' events csv daily, but worst case i'll feed the script a fresh csv once a week.

Example .csv from garmin connect:

Untitled,Lap Swimming,"Wed, Jun 10, 2015 4:44",18:51,"1,000 m",240,--,--,1:53 min/100 m,1:33 min/100 m,--,--,--,--,480,--,12,--,--,40,
Stockholm Running,Running,"Wed, Jul 15, 2015 6:43",37:20,8.07,615,28,5.0,4:37,3:18,177,194,--,--,--,84,--,--,--,--,
SATs,Treadmill Running,"Tue, Jan 26, 2016 17:41",25:01,5.51,466,0,5.0,4:32,4:20,174,194,--,--,--,81,--,--,--,--,
Stockholm Cycling,Cycling,"Thu, Jul 16, 2015 6:33",3:07,1.15,36,6,--,22.1,25.5,--,--,--,--,--,--,--,--,--,--,
Untitled,Walking,"Sat, Sep 20, 2014 8:19",23:07,2.29,165,28,--,10:35,2:25,--,--,--,--,--,--,--,--,--,--,
Untitled,Rowing,"Tue, Sep 16, 2014 15:23",--,2.60,154,--,--,14.2,--,--,--,--,--,--,--,--,--,--,--,
Untitled,Strength Training,"Tue, Jul 14, 2015 6:42",22:11,0.00,0,0,--,0.0,--,--,--,--,--,--,--,--,--,--,--,
Open Water Swim -Tri,Open Water Swimming,"Sun, Aug 23, 2015 9:00",29:41,1.65,383,--,--,3.3,--,--,--,--,--,--,--,--,--,--,--,

Configuration for the parser:

[config]
csv_order: Activity Name,Activity Type,Start,Time,Distance,Calories,Elevation Gain,Training Effect,Avg Speed(Avg Pace),Max Speed(Best Pace),Avg HR,Max HR,Avg Bike Cadence,Max Bike Cadence,sumStrokes,Avg Run Cadence,Avg Strokes,Min Strokes,Best SWOLF,Avg SWOLF

csv_integers: Calories,Elevation Gain,Avg HR,Max HR,Avg Bike Cadence,Max Bike Cadence,sumStrokes,Best SWOLF,Avg SWOLF
csv_floats: Distance,Training Effect,Avg Speed(Avg Pace),Max Speed(Best Pace)

[activities]
Cycling_fields: Activity Name,Activity Type,Start,Time,Distance,Calories,Elevation Gain,Training Effect,Avg Speed(Avg Pace),Max Speed(Best Pace),Avg HR,Max HR,Avg Bike Cadence,Max Bike Cadence,sumStrokes

Lap Swimming_fields: Activity Name,Activity Type,Start,Time,Distance,Calories,Avg Speed(Avg Pace),Max Speed(Best Pace),Avg HR,Max HR,sumStrokes,Avg Strokes,Min Strokes,Best SWOLF,Avg SWOLF

Open Water Swimming_fields: Activity Name,Activity Type,Start,Time,Distance,Calories,Avg Speed(Avg Pace),Max Speed(Best Pace),Avg HR,Max HR,sumStrokes,Avg Strokes,Min Strokes,Best SWOLF,Avg SWOLF

Strength Training_fields: Activity Name,Activity Type,Start,Time,Calories,Avg HR,Max HR

Running_fields: Activity Name,Activity Type,Start,Time,Distance,Calories,Elevation Gain,Training Effect,Avg Speed(Avg Pace),Max Speed(Best Pace),Avg HR,Max HR,Avg Run Cadence

Key things:

  • csv_order: Since you can order/choose fields in garmin, needed to specify the order they will be in.
  • csv_integers/floats: Fields from the csv that should become an integer/floats, otherwise you can't do math in Kibana/ES
  • *_fields: fields for each activity type. The csv will put '--' in each field with no data/irrelevant, to prevent extra fields/cast issues in ES I ommit the fields that aren't relevant to each activity.

I will add host/port for the udp logger and some other parameters when I go back to clean up the initial script.

The relevant logstash configuration was:

input {
  udp {
    port => 6400
    codec => "oldlogstashjson"
    type => "garmin"
    workers => 5
  } 
}
output {
  if [type] == "garmin" {
    elasticsearch {
      hosts => ["localhost:9200"]
      index => "garmin-%{+YYYY.MM.dd}"
      template => "/opt/logstash-custom/templates/garmin.json"
      template_name => "garmin"
    }
  } 
}

The result is what I wanted. I can exclude all of the < 15km bike rides from my overall stats, specify my own ranges/buckets, etc:

Also created views for each activity.

Cycling:

Running:

Swimming:

more ...

RabbitMQ and Logstash

My current setup is a pretty common Logstash stack. It consist of various inputs coming into a non filtering Logstash which dumps these messages into RabbitMQ. From RabbitMQ I can have multiple Logstash indexers slurp from RabbitMQ, apply filtering, and output to Elasticsearch, on to further processing, etc.

The only articles I found when attempting this referenced the AMPQ input/output plugins, which is not how one integrates with RabbitMQ these days. As well, there wasn't much information around tuning. Here is my current configuration along with some comments of various settings I tried/results I experienced.

The flow:

Log/Data inputs -> LS(No filters) -> RabbitMQ -> LS Indexers(filtering) -> Elasticsearch/Other.

RabbitMQ output configuration:

rabbitmq {
    exchange => "logstash-rabbitmq"
    exchange_type => "direct"
    key => "logstash-key"
    host => ""
    workers => 4
    durable => true
    persistent => true
}

RabbitMQ input configuration:

rabbitmq {
    host => ""
    queue => "logstash-queue"
    durable => true
    key => "logstash-key"
    exchange => "logstash-rabbitmq"
    threads => 3
    prefetch_count => 50
    port => 5672
    user => ""
    password => ""
}

Key values:

  • exchange - Match on output and input plugin
  • key - Match on output and input plugin
  • queue - Must be set on input plugin, it should also match on all indexers. Otherwise, a 'random' queue is created each time LS connects.
  • durable - Set to true so queue persist through a crash or restart of RabbitMQ.
  • persistent - Set to true so messages are written to disk and persist through RabbitMQ restarting.

Initially I had a hard time achieving more than 1500msg/sec on the indexer side. This would result in the queue to fill up indicating my Logstash indexers had fallen behind.

RabbitMQ Tuning

At first it would appear the bottleneck is on the RabbitMQ server. Checking iotop one would find allot of disk I/O. RabbitMQ has some great writeups about why and when it writes to disk here. In short, since message acknowledgement is enabled every message is written to disk. This does not mean every message is read from disk, which you can observe from iotop. Lots of writing, no reading. RabbitMQ will eventually start reading from disk if the queue gets large enough and RabbitMQ consumes enough of system memory. I added the following configuration to discourage RabbitMQ from this behaviour:

{vm_memory_high_watermark, 0.8},
{vm_memory_high_watermark_paging_ratio, 0.8}

This is the only configuration I've done thus far with RabbitMQ, and after the Logstash tuning below it may not even be needed. RabbitMQ is fast, and I don't expect it to be my bottleneck anytime soon.

Logstash Tuning

The setting no_ack => true greatly improved the throughput, or so it appeared at first. By default Logstash sends an acknowledgement after each message is processed. Turning off this setting means RabbitMQ will not wait for the 'ack' and continue sending messages to Logstash. This resulted in the queue being empty even under the highest load, and what appeared to be better throughput. Seeing 7-9k/sec events yet nothing in the Queue. Unfortunately this was just an illusion.

Logstash uses a 'SizedQueue' hardcoded to 20 to throttle messages from input -> filter. The intent is if filters are busy this will block inputs, which in theory would stop receiving new events until there is free resources.

This works with no_ack=>false because RabbitMQ plugin sends an ack after it puts the event in the SizedQueue. If the SizedQueue is full it blocks until there is space, which blocks the ack. This in turns prevents more events coming from RabbitMQ, and thus the Queue on RabbitMQ begins filling up.

With no_ack=>true RabbitMQ ignores the prefetch count and sends all of the events in the queue straight into LogStash. Once the SizedQueue is fulll the events continue to pile up behind the ones waiting for resources. Memory consumption grows and eventually OOM Exceptions are thrown. On top of this, you lose every message that had been sent from RabbitMQ -> Logstash since no_ack=>true means RabbitMQ forgets about the message the moment it sends it. You also lose messages every time you restart an indexer with this configuration.

Sending the ack very well may be a performance decrease, though I don't know how much of one, but it certainly is not worth the risk of losing messages.

The way I've been able to increase throughput is by increasing the number of filter workers Logstash uses. According to this Jira issue setting worker threads in sysconfig do not work, so one must use '--filterworkers'. You can set this in LS_OPTS value, or however you wish to pass it at startup. This allows faster processing of events from input->filter thus preventing RabbitMQ from blocking when waiting for a spot in the queue. Unfortunately this limits you to using on filters that are threadsafe.

With these settings we've reached 6-9k/sec per indexer at peak with no hesitation. This performance is greatly dependent on your filters, which we have a considerable amount of.

more ...

Merge Filter for Logstash

The merge filter let's you combine two events that occur within a period into a new single event. This lets you graph/analyze the combination of certain events. The filter is available on github here

Options:

  • key => Unique identifier, used to match the two events you want to merge.
  • order => 'first' or 'last', the order the events should arrive
  • merge_tag => Tag(s) to add on the new event.
  • period => Max length of time between events(seconds).

There is an existing bug in Logstash that impacts filters which create new events. The github issue is here . This bug causes the new event to hit every filter below it in the config, regardless of the conditionals. This can result in additional tags being added, or other filters being applied to the event if they match. Not to mention a performance hit.

Fortuantely there is a work around, albeit crude/cumbersome. The deprecated 'tags => ' and 'type =>' conditionals within a filter statement still work. My current method of minimizing impact from this bug is a three step process.

  • Write the conditional i'd normally use for the merge filter, but instead mutate and add a unique tag to that event. This can be done anywhere in the config.
  • At the very bottom of my filter configuration list the merges out, using the 'tags =>' option with the unique tag added above
  • Use Mutate at after the merges to remove these tags so they do not end up in ElasticSearch.

In my setup I also group all my merges in a single conditional at the bottom of the config to limit the number of events that then are compared against the 'tags =>' conditional. If you have any filters/conditionals without a 'tags =>' option after your merges the event will be ran through it. This same issue applies to the metric, alert, clone, and any other event that creates new Logstash events.

Here is an example configuration doing the above.

input {
  file {
    type => example
    path => "/tmp/exampleData.log"
  }
}

filter {

#work around for event bug, add tags to events I want to track.
  if [type] == "example" {
    if "a" == [message] {
      mutate {
        add_tag => "A"
      }
    }
    if "b" == [message] {
      mutate {
        add_tag => "B"
      }
    }

###Other filters/configuration ###

#merges
    merge {
      tags => "A"
      key => "key-A"
      order => "first"
      merge_tag => "mergeTagA"
      period => 5 
    }
    merge {
      tags => "B"
      key => "key-A"
      merge_tag => "mergeTagB"
      order => "last"
    }
  }

#Remove the temp tags    
  mutate {
    remove_tag => ["A","B"] 
  }
}

output {
  stdout {
    codec => rubydebug
  }
}

Sending this data:

[dopey@dopey ~]# cat a
a
a
b
c
d
[dopey@dopey ~]#

Here is the result:

{
       "message" => "a",
      "@version" => "1",
    "@timestamp" => "2014-08-01T13:45:36.729Z",
          "type" => "example",
          "host" => "dopey.io",
          "path" => "/tmp/exampleData.log",
          "tags" => []
}
{
       "message" => "a",
      "@version" => "1",
    "@timestamp" => "2014-08-01T13:45:36.747Z",
          "type" => "example",
          "host" => "dopey.io",
          "path" => "/tmp/exampleData.log",
          "tags" => []
}
{
       "message" => "b",
      "@version" => "1",
    "@timestamp" => "2014-08-01T13:45:36.750Z",
          "type" => "example",
          "host" => "dopey.io",
          "path" => "/tmp/exampleData.log",
          "tags" => []
}
{
       "message" => "c",
      "@version" => "1",
    "@timestamp" => "2014-08-01T13:45:36.753Z",
          "type" => "example",
          "host" => "dopey.io",
          "path" => "/tmp/exampleData.log"
}
{
       "message" => "d",
      "@version" => "1",
    "@timestamp" => "2014-08-01T13:45:36.758Z",
          "type" => "example",
          "host" => "dopey.io",
          "path" => "/tmp/exampleData.log"
}
#New merged event below.
{
            "@version" => "1",
          "@timestamp" => "2014-08-01T13:45:36.750Z",
              "source" => "dopey.io",
           "merge.key" => "key-A",
    "merge.time_delta" => 0.003,
             "message" => "a",
                "type" => "example",
                "host" => "dopey.io",
                "path" => "/tmp/exampleData.log",
                "tags" => [
        [0] "mergeTagA",
        [1] "mergeTagB"
    ],
           "message-2" => "b"
}

Some future improvements before I submit it to the logstash-contrib:

  • Allow more than 2 events to be tracked/merged. Working on how i'd configure/manage this.
  • Prevent 'add_tag' from being added to the new event -- only merge_tag. If I tried to prevent this behaviour, the results were unpredictable. For now, if you have add_tag on the merge filter the tag will be added to both the original trigger event, and the new event. merge_tag will only be added on the new merged event.
  • Evaluate time on incoming events before overriding existing value. Right now, if your events come out of order the last one seen by logstash will be stored.

I've used this for a variety of use cases so far. It allows me to see how often action A followed by B happened, or A followed by C, etc. Hopefully others find a need as well.

more ...

'Alert' Filter for Logstash

I've attempted to write a filter for logstash. It's called 'Alert', i've submitted a pull request on github for it here. It is a work in progress, but the basic functionality I wanted appears to work. The initial requirements were:

  • Generate a single alert when something goes wrong. Don't spam.
  • Be able to alert on both volume of a particular message or lack thereof
  • If alerting on lack thereof, alert even if there was 0 messages during the period

I started with the throttle filter but felt the use case I wanted to use was a bit different than that filter was intended to do. I used it's code as a base for this filter. Disclaimer: This is my first attempt at Ruby, so I am sure it is quite rough code wise. :D

For all the examples below we will use the typical httpd access logs we all know and love.

input {
  file {
    path => "/var/log/httpd/access_log"
    type => "httpd"
  }
}

filter {
  grok {
    match => ["message", "%{COMBINEDAPACHELOG}" ]
  }
  date {
  #14/Jun/2014:23:31:16 -0400
    match => ["timestamp", "dd/MMM/YYYY:HH:mm:ss Z"]
  }
  • Generate an alert if there are more than 10 404s in a 5 minute period. We will use the [response] field created by %{COMBINEDAPACHELOG} and generate an alert for each message we see with an response code '404'. This is done using the max_threshold option.
#only call alert if response == 404
  if [response] == "404" {
    #generate an alert
    alert {
    max_threshold => 10
    max_threshold_msg => '404 Issues'
    period => 300
    key => "404Alert"
    }
 }

The above uses the key "404Alert" to track these events within the filter. For each trigger of this filter the count will be incremented. If 11 or more occurences are counted within 300 seconds a single event is created for the entire 300 second period.

  • Generate an alert if you do not see atleast 10 '202's in a 5 minute period. Using the same [response] field as above. You have two options when using the min_threshold option. Both options require the below config -- The actual event you are wanting to track:
#only call alert if response == 202
  if [response] == "202" {
    #generate an alert
    alert {
    min_threshold => 10
    min_threshold_msg => 'Traffic to site below threshold'
    period => 300
    key => "202Alert"
    }
 }

This configuration will generate an alert if there is less than 10 events in a 5 minute period. However, the event can only be created when the alert filter is triggered. This means if you have 3 events in the first 5 minutes, then another 90 minutes later you will receive the alert at the 95 minute mark.

To get around this limitation there is a 'heartbeat' flag one can use. This is the second option to min_threshold. Add the alert in either the root of filter(triggers on every event) or in another filter that has a high enough volume of events to ensure it will trigger. It would look like this:

  #Place in a 'high traffic' area. Either root of filter{} or somewhere to ensure the filter is regularly called
  alert {
  heartbeat => true
  min_threshold => 10
  min_threshold_msg => 'Traffic to site below threshold'
  period => 300
  key => "202Alert"
  }

For now you have to mirror your configuration in both alert filters, especially the key as that is how the filter tracks your events. The heartbeat flag causes the filter to only check two things:

  • Does an entry for this key exist? If not, make one and exit
  • If the key does exist, has my time expired? If so, evaluate the min_threshold. Alert if needed, delete key, exit.

The goal is to let you monitor the presence of certain logs to confirm stuff and things are working. If all the things die you still want to receive an alert! Once you've created your filters, you can then leverage the results in output{} . When a threshold alert is triggered a new event is created. The message and tag is configurable, by default the tag is 'alert_filter'. Here is how you could send an email for the 404 alert above.

output {
  if [alert_filter.key] == "202Alert"  {
    email {
      from => "logstash@dopey.io"
      subject => "%{message}"
      to => "dopey@dopey.io"
      via => "sendmail"
      body => "Min Threshold:%{min_threshold}\n\nNum of 202s:%{alert_filter.count}"
      options => { "location" => "/sbin/sendmail" }
    }
  }
}

Possible Options in logstash.conf:

#key - Unique identifier to track/count events
config :key, :validate => :string,  :required => true
#All fields created are formatted as "alert_filter.$tag" by default. Can change with this setting.
#Also a tag will be created for the event with this value.
config :filter_tag, :validate => :string, :default => "alert_filter", :required => false

#Min threshold. Alert is created if # of events is < this number.
config :min_threshold, :validate => :number, :default => -1, :required => false
#Value that will be [message] for the created event. 
config :min_threshold_msg, :validate => :string, :default => "Min Threshold Alert", :required => false

#Max threshold. Alert is created if # of events is > this number.
config :max_threshold, :validate => :number, :default => -1, :required => false
#Value that will be [message] for the created event. 
config :max_threshold_msg, :validate => :string, :default => "Max Threshold Alert", :required => false

#Used with min_threshold to generate alerts independent on the event being tracked. 
config :heartbeat, :validate => :boolean, :default => false

#Time period to track, in seconds.
config :period, :validate => :string, :required => true

Some future enhancements i'd like to do:

  • Not require duplication of configuration when leveraging heartbeat.
  • Configure alarms only during certain times.
  • Improve performance, code is rough.
  • Make various tags created optional/configurable.

Hopefully someone else finds a use for this filter. We are just starting to implement this ourselves so I will likely be tweaking it as I find problem areas.

more ...

Snapshots in ElasticSearch

I'm in the process of building out a logstash setup at work. We have a considerable amount of logs from a number of sources. One thing I wanted to figure out was how to backup/restore the various dashboards I am making along the way. Doing them one at a time from Kibana seemed inefficient. ElasticSearch snapshot feature is the answer. In general it's to backup/restore any/all of your indices. Your dashboards are stored in kibana-int index.

The steps are listed out here Here. Here is how it went for me. There isn't much more here than what is on that page, their instructions are quite good:)

Create the local repo:

curl -XPUT 'http://localhost:9200/_snapshot/dopey_backup' -d '{
    "type": "fs",
    "settings": {
        "compress" : true,
        "location": "/var/data/elasticsearch/backup"
    }
}'

The directory used for backups needs to be writable by the elasticsearch users:

[dopey@dopey-logstash ~]#  curl -XPUT "localhost:9200/_snapshot/dopey_backup/snapshot_1?wait_for_completion=false"
{"error":"SnapshotCreationException[[dopey_backup:snapshot_1] failed to create snapshot]; nested: FileNotFoundException[/var/data/elasticsearch/backup/snapshot-snapshot_1 (Permission denied)]; ","status":500}
[dopey@dopey-logstash ~]# chown -R elasticsearch:elasticsearch /var/data/elasticsearch/backup/
[dopey@dopey-logstash ~]#  curl -XPUT "localhost:9200/_snapshot/dopey_backup/snapshot_1?wait_for_completion=false"
{"accepted":true}

You can see the backup being built in your set location:

[dopey@dopey-logstash ~]# ls -lh /var/data/elasticsearch/backup/
total 16K
-rw-r--r--. 1 elasticsearch elasticsearch   31 Jul  2 13:27 index
drwxr-xr-x. 5 elasticsearch elasticsearch 4.0K Jul  2 13:27 indices
-rw-r--r--. 1 elasticsearch elasticsearch  522 Jul  2 13:27 metadata-snapshot_1
-rw-r--r--. 1 elasticsearch elasticsearch  256 Jul  2 13:27 snapshot-snapshot_1
[dopey@dopey-logstash ~]#

Check on status of the backups:

[dopey@dopey-logstash ~]# curl -s -XGET "localhost:9200/_snapshot/dopey_backup/_all"| python2 -mjson.tool
{
    "snapshots": [
        {
            "duration_in_millis": 7397, 
            "end_time": "2014-07-02T11:39:08.893Z", 
            "end_time_in_millis": 1404301148893, 
            "failures": [], 
            "indices": [
                "logstash-2014.07.02", 
                "kibana-int"
            ], 
            "shards": {
                "failed": 0, 
                "successful": 10, 
                "total": 10
            }, 
            "snapshot": "snapshot_1", 
            "start_time": "2014-07-02T11:39:01.496Z", 
            "start_time_in_millis": 1404301141496, 
            "state": "SUCCESS"
        }
    ]
}
[dopey@dopey-logstash ~]#

The kibana-int indice is what contains your dashboards. If I ever wanted to just restore those i'd do:

curl -XPOST "localhost:9200/_snapshot/dopey_backup/snapshot_1/_restore" -d '{
    "indices": "kibana-int",
    "ignore_unavailable": "true",
    "include_global_state": false

}'
more ...

Learnings from Logstash

I've been a user of splunk before, and can speak first hand the value of being able to visualize large sets of data. You simply can identify issues/patterns/stuff that you'd never otherwise see. I've started working with logstash at my new company, it's been a great experience. I am notorious for skimming docs, and experimenting to figure things out..So Here are some various things i've learned/bashed my head against on the way. I am sure many, if not all, are explained in the docs :)

Usefool tools:

  • Grok Debugger -- Simply amazing. Once you get the hang of logstash/filters, it makes building new filters a breeze.
  • #logstash @ freenode - Friendly and helpful
  • Logstash.net and elasticsearch.org have top notch documentation.

Logstash leverages grok which has many prebuilt patterns that make standardized logs a breeze to import. I have a great deal of custom logs, which left me with building(and still much left) customized grok patterns. A few tips:

Start off with the raw logs going into logstash. Find the field you'd like to build a pattern for to better tag/break down. i.e. 'message' field. Take that field to the grok debugger and build your pattern. Once you have your pattern build your config.

input {
  syslog {
    type => syslog
    port => 2514
  }
}

filter {

  if [type] == "syslog" {
    grok {
      break_on_match => "true"
      match => [ "message", "%{TIMESTAMP_ISO8601:timestamp} %{GREEDYDATA:junk} took '%{NUMBER:response_time:int}' ms%{GREEDYDATA:junk}Stuff Made = %{NUMBER:stuff_made:int}%{GREEDYDATA:junk}Things made = %{NUMBER:things_made:int}%{GREEDYDATA:junk}"]
      add_tag => [ "stuff", "things" ]
      tag_on_failure => []
    }
  }
}

Pretty simple config, things I bashed my head against:

  • Building a grok for the entire log entry as it came from syslog. The match line is only matching against the 'message', not the entire line. Logstash is smart enough to get the timestamp, logsource, program name, etc and leaves the rest of it was 'message'.
  • All entries were receiving '_grokparsefailure' tag, even when they also got the tags I set. I believe this is due to me attempting to match lines on filters that fail(hence the tag). The end goal is to only apply a filter to a line I expect to match, but until then using 'tag_on_failure = []' will prevent this duplicate tag from being created.
  • 'type' can be anything you want. 'syslog' is an input plugin, and 'message' is a field of data -- and in this case created automatically by using the syslog input plugin.
  • Many tutorials use type => 'syslog' in the grok statement. This is deprecated, the above is the current method.
  • If you want to graph on a number you tag in a log, you need to include the :int after the semantic name like above. Otherwise you will get a class exceptio when building the graph.

Handy commands to use with ElasticSearch:

curl -XDELETE 'http://localhost:9200/dopeysIndex*/'

I initially set logstash up, configured the syslog plugin and pumped everything into it -- a few months ago. The result? A ton of logs, but not very usable. I could search over a large set but I couldn't graph response time, error codes, or anything of real use. It was a very good method of consuming large amounts of disk space though:). The above command lets you delete indexes. Either rotate older indexes or wipe out everything. Be careful though, kibana-int holds your dashboards and you can just as easily delete it ;). I wrote another page on using snapshots to backup data in general, or specific indexes such as kibana-int here .

Queries in Kibana:

  • Lucene query article from ElasticSearch
  • You can do things like _exists_:$tag, or tag:(query1 query2). This lets you create graphs that may cross multiple tags, but still limit data how you want. This also goes back to how you build the dataset, which is something I am still going back and forth on.
  • AND, OR, NOT are how you string queries together. All of this is in the above link, but I know myself and other colleagues felt a bit unimpressed by kibana's search initially until we learned the Lucene query language. Much better now.

Things I am still wrestling with:

  • How to layout logstash.conf. With the amount of custom logs I am parsing it can get messy in a hurry.
  • Best use of tags/fields. By role, vendor, both? Many queries may cross roles/vendors but I'd still want to filter down when I can to improve performance.
  • How to deal with logs I am not tagging. Store to a different index I rotate more frequent and store tagged logs only in another? Discard them instantly?
  • Whether to use logstash-forwarder or not, currently not
more ...

Purging Varnish

Using Varnish means content is cached. A pretty essential requirement is to have the ability to purge(or ban in Varnish 3) content on demand.

There is a couple ways to do this, you can modify your vcl to have such functions so you can do a PURGE request with the desired URL..Or you can use varnishadm. I am using varnish 3+, which means the purge command has been replaced with ban. Here is the varnishadm command to purge/ban all documents under http://dopey.io/drafts/*

varnishadm -S /etc/varnish/secret -T localhost:6082 ban.url drafts/*

I was going to limit purge request to localhost anyway, so it seemed simpliest to use varnishadm for my requirements. I wrote a little script to aid in publishing new post. It will find any changes in my content then purge those pages automatically. It will also purge all drafts, categories, tags and the index page.

#!/bin/sh
cd /var/www/html/dopey/
mkdir -p /tmp/dopey
make html
md5sum /var/www/html/dopey/content/* 2>/dev/null > /tmp/dopey/content.new
while read line; do
  grep "^$line$" /tmp/dopey/content &>/dev/null || {
    page=$(echo $line | awk '{print $2}')
    slug=$(grep "^Slug:" $page | awk -F: '{print $2}' | tr -d ' ')
    echo "Purged http://dopey.io/$slug.html"
    varnishadm -S /etc/varnish/secret -T localhost:6082 ban.url $slug.html &>/dev/null
  }
done < /tmp/dopey/content.new
varnishadm -S /etc/varnish/secret -T localhost:6082 ban.url /category/* &>/dev/null
varnishadm -S /etc/varnish/secret -T localhost:6082 ban.url /tags/* &>/dev/null
varnishadm -S /etc/varnish/secret -T localhost:6082 ban.url / &>/dev/null
varnishadm -S /etc/varnish/secret -T localhost:6082 ban.url drafts/* &>/dev/null
mv /tmp/dopey/content.new /tmp/dopey/content
more ...

Varnish and Pelican Migration

I decided to move off wordpress. A couple former colleagues used Pelican and I've always wanted to try it. Also took this chance to configure varnish infront of all my sites. I've been over deployments of varnish, but this is my first time deploying it for personal use. I used my friend Scott's writeup on varnish as a base. There are a few differences on Fedora though, such as systemd being configured different than /etc/default method.

Let's go..

Install varnish, included in Fedora's Main repos

[root@jmorgan dopey] yum install varnish
Resolving Dependencies
--> Running transaction check
---> Package varnish.x86_64 0:3.0.3-5.fc17 will be installed
--> Processing Dependency: varnish-libs = 3.0.3-5.fc17 for package: varnish-3.0.3-5.fc17.x86_64
--> Processing Dependency: libvarnishapi.so.1(LIBVARNISHAPI_1.0)(64bit) for package: varnish-3.0.3-5.fc17.x86_64
--> Processing Dependency: jemalloc for package: varnish-3.0.3-5.fc17.x86_64
--> Processing Dependency: libvgz.so()(64bit) for package: varnish-3.0.3-5.fc17.x86_64
--> Processing Dependency: libvcl.so()(64bit) for package: varnish-3.0.3-5.fc17.x86_64
--> Processing Dependency: libvarnishcompat.so()(64bit) for package: varnish-3.0.3-5.fc17.x86_64
--> Processing Dependency: libvarnishapi.so.1()(64bit) for package: varnish-3.0.3-5.fc17.x86_64
--> Processing Dependency: libvarnish.so()(64bit) for package: varnish-3.0.3-5.fc17.x86_64
--> Processing Dependency: libjemalloc.so.1()(64bit) for package: varnish-3.0.3-5.fc17.x86_64
--> Running transaction check
---> Package jemalloc.x86_64 0:3.4.0-1.fc17 will be installed
---> Package varnish-libs.x86_64 0:3.0.3-5.fc17 will be installed
--> Finished Dependency Resolution

Dependencies Resolved

==============================================================================================================================================================
 Package                                 Arch                              Version                                   Repository                          Size
==============================================================================================================================================================
Installing:
 varnish                                 x86_64                            3.0.3-5.fc17                              updates                            344 k
Installing for dependencies:
 jemalloc                                x86_64                            3.4.0-1.fc17                              updates                             97 k
 varnish-libs                            x86_64                            3.0.3-5.fc17                              updates                            154 k

Transaction Summary
==============================================================================================================================================================
Install  1 Package (+2 Dependent packages)

Total download size: 596 k
Installed size: 1.5 M
Is this ok [y/N]: y
Downloading Packages:
(1/3): jemalloc-3.4.0-1.fc17.x86_64.rpm                                                                                                |  97 kB  00:00:00     
(2/3): varnish-libs-3.0.3-5.fc17.x86_64.rpm                                                                                            | 154 kB  00:00:00     
(3/3): varnish-3.0.3-5.fc17.x86_64.rpm                                                                                                 | 344 kB  00:00:01     
--------------------------------------------------------------------------------------------------------------------------------------------------------------
Total                                                                                                                         369 kB/s | 596 kB     00:01     
Running Transaction Check
Running Transaction Test
Transaction Test Succeeded
Running Transaction
  Installing : jemalloc-3.4.0-1.fc17.x86_64                                                                                                               1/3 
  Installing : varnish-libs-3.0.3-5.fc17.x86_64                                                                                                           2/3 
  Installing : varnish-3.0.3-5.fc17.x86_64                                                                                                                3/3 
  Verifying  : varnish-3.0.3-5.fc17.x86_64                                                                                                                1/3 
  Verifying  : varnish-libs-3.0.3-5.fc17.x86_64                                                                                                           2/3 
  Verifying  : jemalloc-3.4.0-1.fc17.x86_64                                                                                                               3/3

Installed:
  varnish.x86_64 0:3.0.3-5.fc17

Dependency Installed:
  jemalloc.x86_64 0:3.4.0-1.fc17                                              varnish-libs.x86_64 0:3.0.3-5.fc17

Complete!
[root@jmorgan dopey]

Instead of configuring varnish in /etc/default/varnish in systemd/Fedora these configuration values are found in /etc/varnish/varnish.params and are referenced by /usr/lib/systemd/system/varnish.service .

The jist of the setup is varnish starts listening on 80, instead of apache, then it request locally to apache on 8080, if not cached, and then returns the needful back to the client. To accomplish this I needed to change apache to listen on a different port, 8080, and for varnish to listen on 80.

Values changed in /etc/httpd/conf/httpd.conf

Listen 8080
NameVirtualHost *:8080
#Then each virtual host
<VirtualHost *:8080>

I also needed to change /etc/varnish/varnish.params.

# Default address and port to bind to. Blank address means all IPv4
# and IPv6 interfaces, otherwise specify a host name, an IPv4 dotted
# quad, or an IPv6 address in brackets.
# VARNISH_LISTEN_ADDRESS=192.168.1.5
VARNISH_LISTEN_PORT=80

The default port was 6081 which. Not changing this setting but changing apache would result in your site being down hard :)

As Scott and others point out to get your IP's correct in httpd logging you need to add make varnish forward it and apache to change it's log format.

I changed this section of /etc/varnish/default.vcl

 if (req.restarts == 0) {
    if (req.http.x-forwarded-for) {
        set req.http.X-Real-Forwarded-For = req.http.X-Forwarded-For + ", " + regsub(client.ip, ":.*", "");
        unset req.http.X-Forwarded-For;
    } else {
        set req.http.X-Real-Forwarded-For =  regsub(client.ip, ":.*", "");
    }
 }

Initially it tried to set X-Forwarded-For which seemed to fail. I stole Scott's version of the config and it worked like a charm.

For apache, I modified /etc/httpd/conf/httpd.conf to use a new log format. Instead of changing each virtual host, I just changed the default line outside of the virtual host. If I later want to split my site's logs off I will, but for now access.log works.

LogFormat "%{X-Real-Forwarded-For}i %l %u %t \"%r\" %>s %b \"%{Referer}i\" \"%{User-Agent}i\"" varnishcombined
CustomLog logs/access_log varnishcombined

Restart varnish and apache and test your site. We can see varnish is working:

[root@jmorgan conf] varnishlog 
....
12 SessionOpen  c 213.89.160.129 34289 :80
12 ReqStart     c 213.89.160.129 34289 376648113
12 RxRequest    c GET
12 RxURL        c /
12 RxProtocol   c HTTP/1.1
12 RxHeader     c User-Agent: curl/7.37.0
12 RxHeader     c Host: dopey.io
12 RxHeader     c Accept: */*
12 VCL_call     c recv lookup
12 VCL_call     c hash
12 Hash         c /
12 Hash         c dopey.io
12 VCL_return   c hash
12 Hit          c 376648063
12 VCL_call     c hit deliver
12 VCL_call     c deliver deliver
12 TxProtocol   c HTTP/1.1
12 TxStatus     c 200
12 TxResponse   c OK
12 TxHeader     c Server: Apache/2.2.23 (Fedora)
12 TxHeader     c Last-Modified: Sun, 29 Jun 2014 16:45:15 GMT
12 TxHeader     c ETag: "87ccd-48ac-4fcfc445d7c9c"
12 TxHeader     c Vary: Accept-Encoding,User-Agent
12 TxHeader     c Content-Type: text/html; charset=UTF-8
12 TxHeader     c Transfer-Encoding: chunked
12 TxHeader     c Date: Sun, 29 Jun 2014 16:52:30 GMT
12 TxHeader     c X-Varnish: 376648113 376648063
12 TxHeader     c Age: 84
12 TxHeader     c Via: 1.1 varnish
12 TxHeader     c Connection: keep-alive
12 Gzip         c U D - 4500 18604 80 80 35934
12 Length       c 18604
12 ReqEnd       c 376648113 1404060750.428263187 1404060750.428411722 0.000087261 0.000025749 0.000122786
12 Debug        c herding
12 SessionClose c no request
12 StatSess     c 213.89.160.129 34289 0 1 1 0 0 0 353 18604

Notice the "hit deliver", compared to:

VCL_call     c miss fetch

varnishlog and varnishstat are both quite handy for confirming/triaging your varnish setup.

Overall a pretty smooth migration to Pelican with a varnish setup. I still have some cleanup of the imported post, such as tags and links.

more ...

Dogecoin mining pool 'Dopey's Pool'

Check it out! -- I've gotten out of the mining business:) Was a fun expirement.. Article is here as an archive now.

This is used to mine Dogecoin, which you can find more about Dogecoin in general below:
http://www.dogecoin.info
http://reddit.com/r/dogecoin

Here is a youtube video from the founder explaining Dogecoin.

A getting started article from dogecoin.com for my non-geeky friends that just want to obtain and use Dogecoin.
http://dogecoin.com/get-started

Mining is a bit more on the geeky side, and is not something the average person needs to do to obtain or spend dogecoin. If you're interested in mining I suggest checking out the dogemining subreddit.

The general use of crypto currencies is something many of us expect to be mainstream some day. It's growing in popularity and if you haven't heard about it yet, you likely will soon.

Think of it is an internet currency that allows you to quickly and easily send and receive money(dogecoin) online. More and more companies are accepting it as a form of payment, and startup companies are appearing to fill this new niche. It's going to be pretty neat seeing it all unfold.

more ...

One USB Drive, Two Partitions. Much useful.

In a follow up to the Dogecoin client install post, here is steps to create multiple partitons on a single USB drive so one can both boot and store files on the same USB drive.

Partition the USB drive. I made two partitions. One 2GB FAT32, and 28.5GB ext4. I initially did this for Arch Linux, but added/changed to Ubuntu for dogecoin users. A few of the steps below when partitioning are not actually needed when you use unetbootin to write the iso, however there is no harm in doing them.

[jmorgan@arch-dopey ~]$ sudo fdisk /dev/sdc

Welcome to fdisk (util-linux 2.24).  
Changes will remain in memory only, until you decide to write them.  
Be careful before using the write command.

#Current (Empty)  
Command (m for help): p  
Disk /dev/sdc: 30.5 GiB, 32717537280 bytes, 63901440 sectors  
Units: sectors of 1 * 512 = 512 bytes  
Sector size (logical/physical): 512 bytes / 512 bytes  
I/O size (minimum/optimal): 512 bytes / 512 bytes  
Disklabel type: dos  
Disk identifier: 0xc3072e18

#Create 2GB Partition  
Command (m for help): n

Partition type:  
p primary (0 primary, 0 extended, 4 free)  
e extended  
Select (default p): p  
Partition number (1-4, default 1):  
First sector (2048-63901439, default 2048):  
Last sector, +sectors or +size{K,M,G,T,P} (2048-63901439, default
63901439): +2GB

Created a new partition 1 of type 'Linux' and of size 1.9 GiB.  
#Change type  
Command (m for help): t  
Selected partition 1  
Hex code (type L to list all codes): L

0 Empty 24 NEC DOS 81 Minix / old Lin bf Solaris  
1 FAT12 27 Hidden NTFS Win 82 Linux swap / So c1 DRDOS/sec (FAT-  
2 XENIX root 39 Plan 9 83 Linux c4 DRDOS/sec (FAT-  
3 XENIX usr 3c PartitionMagic 84 OS/2 hidden C: c6 DRDOS/sec (FAT-  
4 FAT16 \<32M 40 Venix 80286 85 Linux extended c7 Syrinx  
5 Extended 41 PPC PReP Boot 86 NTFS volume set da Non-FS data  
6 FAT16 42 SFS 87 NTFS volume set db CP/M / CTOS / .  
7 HPFS/NTFS/exFAT 4d QNX4.x 88 Linux plaintext de Dell Utility  
8 AIX 4e QNX4.x 2nd part 8e Linux LVM df BootIt  
9 AIX bootable 4f QNX4.x 3rd part 93 Amoeba e1 DOS access  
a OS/2 Boot Manag 50 OnTrack DM 94 Amoeba BBT e3 DOS R/O  
b W95 FAT32 51 OnTrack DM6 Aux 9f BSD/OS e4 SpeedStor  
c W95 FAT32 (LBA) 52 CP/M a0 IBM Thinkpad hi eb BeOS fs  
e W95 FAT16 (LBA) 53 OnTrack DM6 Aux a5 FreeBSD ee GPT  
f W95 Ext'd (LBA) 54 OnTrackDM6 a6 OpenBSD ef EFI (FAT-12/16/  
10 OPUS 55 EZ-Drive a7 NeXTSTEP f0 Linux/PA-RISC b  
11 Hidden FAT12 56 Golden Bow a8 Darwin UFS f1 SpeedStor  
12 Compaq diagnost 5c Priam Edisk a9 NetBSD f4 SpeedStor  
14 Hidden FAT16 \<3 61 SpeedStor ab Darwin boot f2 DOS secondary  
16 Hidden FAT16 63 GNU HURD or Sys af HFS / HFS+ fb VMware VMFS  
17 Hidden HPFS/NTF 64 Novell Netware b7 BSDI fs fc VMware VMKCORE  
18 AST SmartSleep 65 Novell Netware b8 BSDI swap fd Linux raid auto  
1b Hidden W95 FAT3 70 DiskSecure Mult bb Boot Wizard hid fe LANstep  
1c Hidden W95 FAT3 75 PC/IX be Solaris boot ff BBT  
1e Hidden W95 FAT1 80 Old Minix  
#b is FAT32  
Hex code (type L to list all codes): b  
If you have created or modified any DOS 6.x partitions, please see the
fdisk documentation for additional information.  
Changed type of partition 'Linux' to 'W95 FAT32'.

#Change bootable flag  
Command (m for help): a  
Selected partition 1  
#Create 28.5GB partition  
Command (m for help): n

Partition type:  
p primary (1 primary, 0 extended, 3 free)  
e extended  
Select (default p):

Using default response p.  
Partition number (2-4, default 2):  
First sector (3907584-63901439, default 3907584):  
Last sector, +sectors or +size{K,M,G,T,P} (3907584-63901439, default
63901439):

Created a new partition 2 of type 'Linux' and of size 28.6 GiB.  
#Write partition table  
Command (m for help): w  
The partition table has been altered.  
Calling ioctl() to re-read partition table.  
Syncing disks.

[jmorgan@arch-dopey ~]$

Create the filesystems, FAT32 and ext4 for me.

#FAT32 -- For Arch bootable iso, this label must match the release
version used -- Not important for Ubuntu/unetbootin  
[jmorgan@arch-dopey ~]$ sudo mkdosfs -F 32 -n ARCH_201401 /dev/sdc1  
mkfs.fat 3.0.24 (2013-11-23)  
#ext4  
[jmorgan@arch-dopey ~]$ sudo mkfs.ext4 /dev/sdc2  
mke2fs 1.42.8 (20-Jun-2013)  
Filesystem label=  
OS type: Linux  
Block size=4096 (log=2)  
Fragment size=4096 (log=2)  
Stride=0 blocks, Stripe width=0 blocks  
1875968 inodes, 7499232 blocks  
374961 blocks (5.00%) reserved for the super user  
First data block=0  
Maximum filesystem blocks=4294967296  
229 block groups  
32768 blocks per group, 32768 fragments per group  
8192 inodes per group  
Superblock backups stored on blocks:  
32768, 98304, 163840, 229376, 294912, 819200, 884736, 1605632,
2654208,  
4096000

Allocating group tables: done  
Writing inode tables: done  
Creating journal (32768 blocks): done  
Writing superblocks and filesystem accounting information: done

[jmorgan@arch-dopey ~]$

At this point you have a single USB drive with two partitions. One with the intent of being used for bootable image(Ubuntu, Arch, etc) and the other for storing data.

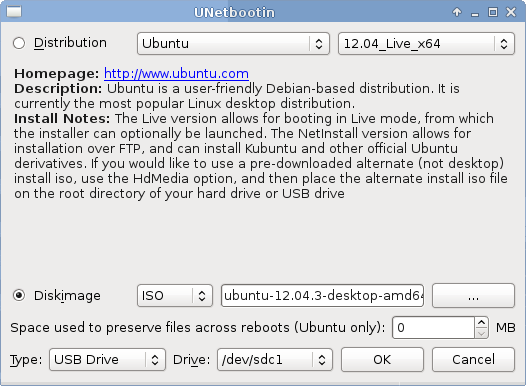
If you are reading this post for Dogecoin I suggest using unetbootin along with Ubuntu 12.04 iso. Select the Ubuntu iso, and specify the smaller(first) partition to write to. You can store the needed files for the client install on the other partition. Here is how.

You can let unetbootin download the iso for you, or in my case use a local iso. I've already downloaded Ubuntu 64-bit 12.04. I've selected this iso, and the first partition on the USB drive(sdc1).

unetbootin

Checking what we've done, and storing needed files onto the second partition.

#mount the partiton unetbootin wrote Ubuntu 12.04 to:  
[jmorgan@arch-dopey ~]$ sudo mount /dev/sdc1 /mnt/os  
#mount the partition used for storage.  
[jmorgan@arch-dopey ~]$ sudo mount /dev/sdc2 /mnt/files  
#contents of what unetbootin created  
[jmorgan@arch-dopey ~]$ ls /mnt/os/  
arch dists ldlinux.c32 menu.c32 README.diskdefines ubninit  
autorun.inf EFI ldlinux.sys pics syslinux ubnkern  
boot install loader pool syslinux.cfg ubnpathl.txt  
casper isolinux md5sum.txt preseed ubnfilel.txt wubi.exe  
[jmorgan@arch-dopey ~]$

#copying dogecoin-qt tar with deps, and script to build dogecoin-qt
after booting Ubuntu 12.04.  
[jmorgan@arch-dopey ~]$ sudo cp
dogecoin-qt-1.5-ubuntu-12.04-Live-Install.tar /mnt/files/  
[jmorgan@arch-dopey ~]$ ls
/mnt/files/dogecoin-qt-1.5-ubuntu-12.04-Live-Install.tar  
[jmorgan@arch-dopey ~]$

At this point you can follow the previous post, Dogecoin Ubuntu Live CD Installer. I personally carry a USB bottle opener my sister gave me which has a bootable linux distro on one partition, and storage on the other. At any time I can open a beer, and boot linux!In that order ofcourse. :)

Doge: D8kWKgF2x6gsiZzRyXgonogPQuRMxf6qtp

more ...